
OpenTelemetry is an observability framework designed to help developers collect and export telemetry data from their applications. It provides a set of APIs and SDKs, a telemetry data protocol, semantic conventions, and tools to receive, process, and export telemetry data. Unlike visualization or storage tools, OpenTelemetry focuses on generating and collecting data that can be sent to various backends for analysis.
This subject was presented at a Python meet-up (video is in French 🇫🇷):
Understanding Telemetry Signals
OpenTelemetry defines several types of telemetry signals:
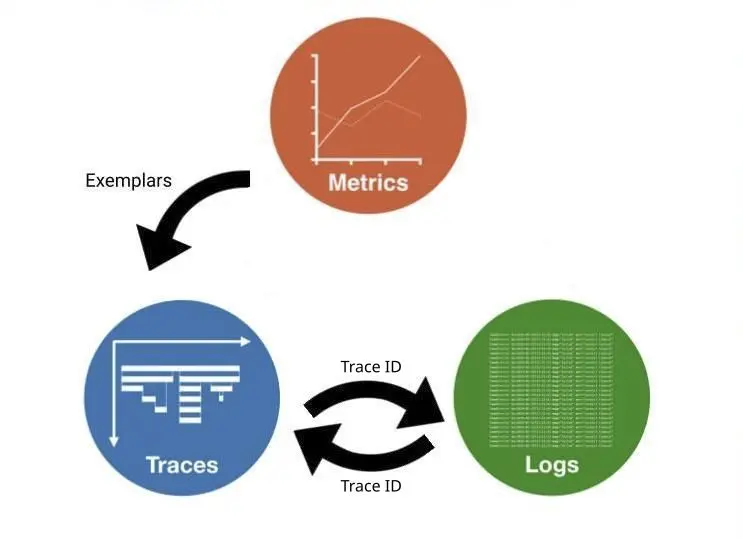
- Traces: Similar to stack traces across applications and libraries, traces are split into spans, each with a name, attributes, and a parent ID.
- Metrics: These are numerical values to track, with predefined types such as counters, gauges, and histograms.
- Logs: While logs are familiar to most developers, the challenge lies in adding attributes like trace IDs to link logs with traces.
- Baggage: A key/value store sent across processes.
To help understanding an event, the telemetry has attributes to link the various signals. In particular the trace id and the span id (a span is a sub-part of a trace) allow to link traces and logs. But they also link metrics exemplars (aka sampled metrics events) to traces.
Pros and Cons of OpenTelemetry
Pros
- Auto-instrumentation: Simplifies the process of instrumenting code.
- Vendor Neutral: Works with multiple backends.
- High Adoption: Widely adopted and incubated at the Cloud Native Computing Foundation (CNCF).
Cons
- Language SDKs Vary: Different languages have different levels of support and features.
- Standardization is Slow: Standards may not cover everything you need.
Using it with Python
To demonstrate how to use OpenTelemetry with Python services, consider a demo involving three identical microservices using FastAPI that can call each others. Their telemetry is sent to aggregators; Tempo for the traces, Prometheus for the metrics and Loki for the logs.
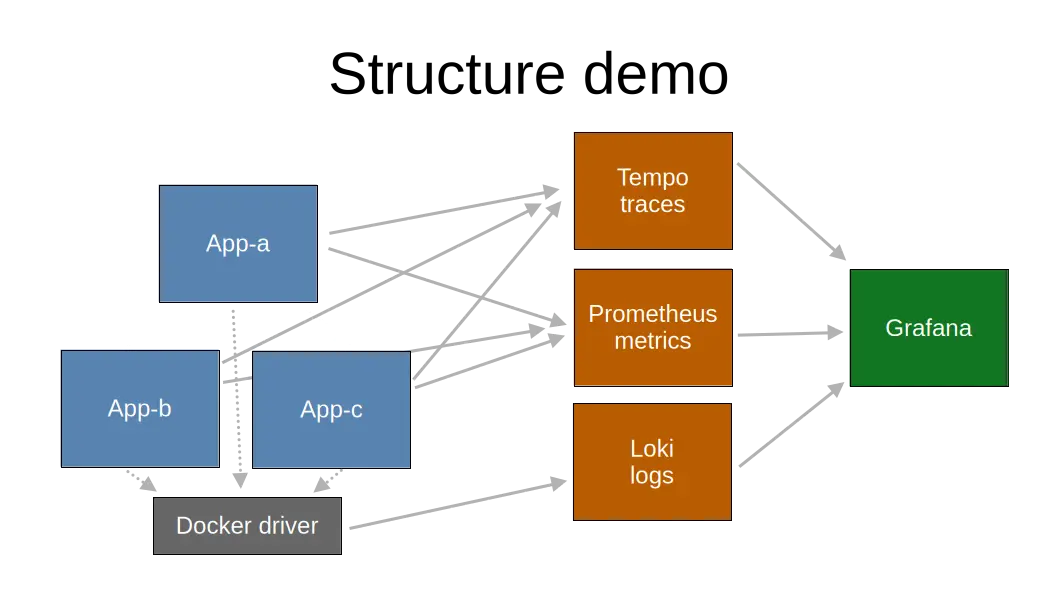
You can refer to the demo code available at https://github.com/webscit/opentelemetry-demo-python.
The demo illustrates different levels of instrumentation:
- Manual Instrumentation: Involves deep code changes.
- Programmatic Instrumentation: Requires light changes.
- Zero-code Instrumentation: No changes needed.
The latest is the easiest to test and only requires to change the python service startup command by using opentelemetry-instrument python ... . This will automatically monkey patch all supported library in your Python environment and it will create metrics respecting the semantic defined by OpenTelemetry.
Sum up
OpenTelemetry provides a robust framework for instrumenting Python services, offering flexibility and comprehensive telemetry data collection. Whether you are looking to implement manual, programmatic, or zero-code instrumentation, OpenTelemetry offers tools and standards to meet your needs.
For further details and to explore the demo, visit the opentelemetry-demo-python repository.
If you are interested by our work, don't hesitate to reach out.
Resources
For more information on OpenTelemetry, check out the following resources:
- OpenTelemetry official site
- Zero-code instrumentation for Python
- OpenTelemetry Python Contrib
- A deep dive into OpenTelemetry metrics